|
|||||
|
|
|||||
|
|||||
|
|
|||||
|
Intercultural Perspectives on the Complementary Application and Evidence-Based Research of Chinese and Western Herbal Medicine in Geriatric Healthcare / 跨文化视角下中西方草药在老年保健中的互补应用与循证医学研究 cnXiv2026060605W Author/作者:Charles Cheng Xia Published/发布于: 2026 Abstract Keywords:
Aging; Chinese Herbal Medicine; Western Herbalism; Neuroendocrine-Immune
Network (NEI); Herb-Drug Interactions (HDI); Evidence-Based Medicine
|
|||||
| A ratio and formula for transmission dynamics of COVID-19
cnXiv2020072805W xc20200728.cnxiv [PDF] 6 pages Cheng Xia July 28, 2020 A ratio and formula for transmission dynamics of COVID-19 Abstract A
basic reproductive number Ro is an important in dynamics of a newly
emerged and rapidly growing infectious disease outbreak, such as
COVID-19. However, the current researches indicated that Ro for
COVID-19 is quite affected by many other factors or parameters. To
find the alternative index for the reality of spread of the
COVID-19, a study based on the population of 2,067.14 millions from
seven countries, USA, UK, Brazil, India, South Africa, Canada and
Sweden, was conducted and the weekly new case ratio as index for
mathematical method or anticipatable formula for application was
introduced. In addition, it could be used for evaluating Ro value
and setting a methodological formula or index for other contagious
disease in the future.
|
|||||
|
A
ratio and formula for transmission dynamics of COVID-19 Cheng Xia
xc7788@gmail.com Abstract A
basic reproductive number Ro is an important in dynamics of a newly
emerged and rapidly growing infectious disease outbreak, such as
COVID-19. However, the current researches indicated that Ro for
COVID-19 is quite affected by many other factors or parameters. To
find the alternative index for the reality of spread of the
COVID-19, a study based on the population of 2,067.14 millions from
seven countries, USA, UK, Brazil, India, South Africa, Canada and
Sweden, was conducted and the weekly new case ratio as index for
mathematical method or anticipatable formula for application was
introduced. In addition, it could be used for evaluating Ro value
and setting a methodological formula or index for other contagious
disease in the future. Introduction The
transmission dynamics or epidemiological transmission model of
COVID-19 is critical to develop effective public health and
infection prevention measures to break chains transmission. To
obtain and select the index for the transmission dynamics are key
factors to be success in application of the model. Ro,
pronounced "R naught", is a mathematical term that
indicates how contagious an infectious disease is. It's also
referred to as the reproduction number Ro; defined as the average
number of secondary cases attributable to infection by an index case
after that case is introduced into a susceptible population. Ro is
an important in dynamics of COVID-19 outbreak. However,
the current researches indicated that Ro for COVID-19 is quite
affected by many other factors or parameters. The R0 for COVID-19 is
a median of 5.7, according to a study published online in Emerging
Infectious Diseases [1]. That's about double an earlier R0
estimate of 2.2 to 2.7 [2]. A early serials of studies
estimates of R0 for COVID-19 shows that the estimates ranged from
1.4 to 6.49, with a mean of 3.28, a median of 2.79 and inter
quartilerange (IQR) of 1.16 [3]. As
the range of R0 for COVID-19 varied, the estimation from their
transmission dynamics or epidemiological transmission model of
COVID-19 varied as well. How to find an indication as a useful
calculation for predicting and controlling the transmission of
COVID-19 disease is important and urgent for the public health in
the world. Instated of Ro for COVID-19, a new ratio and formula for
transmission dynamics of COVID-19 was introduced to anticipate and
measure COVID-19 disease that may spread in a susceptible population
in this study. The study was based on the large set of data from the
population of 2,067.14 millions in seven counties, USA, UK, Brazil,
India, South Africa, Canada and Sweden, with varieties of
geographic, culture, medical and health resources, and so on [4].
By comparing and analyzing the data in this large scale and taking
account of other possible of varieties by country, a ratio as an
coefficient used to a formula calculation was found for predicting
and controlling the transmission of COVID-19. Methods Overview The
Ro for a contagious disease, such as COVID-19, is quite affected by
many other factors or parameters and those factors or parameters are
often mixed in their role in the reality, therefore we could take
the account of those factors or parameters in the realty of
transmission modules for study. Based on a large scale of data,
large numbers of new cases with wide range of population, geographic
and cultural differences and varieties of other factors, it could
bring the actual index to set the experiencing model to estimate the
trend of the transmission spread. In other word, the importance of
those factors or parameters affecting the Ro for COVID-19 would be
diluted and their role would be mixed in reflection on a large-scale
base for the reality of transmission model of a contagious disease,
COVID-19. In
this study, a new calculation method was adopted for a ratio, as an
indication of transmitting speed of the COVID-19. The definition of
the ratio: the number of weekly new cases divided by the number of
previous weekly new cases. The ratio is expressed as A to B, A
divided by B, or A: B; where the A and B is the number of new case
based on daily reports and accumulated in a whole week. The new case
is a tested and confirmed case and a week is a seven consecutive day
counted. The main reason to select a period of week is diluting the
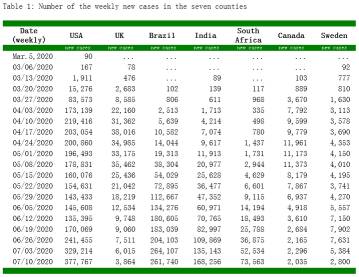
daily reports by possible incidence or errors. Steps: 1.Calcuating
the number of the weekly new cases from each country. The number of
weekly new cases in the seven countries between the early of March
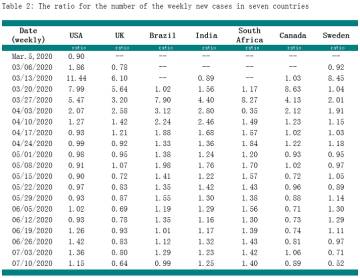
2020 and July 10, 2020 showed in Table 1 (see the Tables attached). 2.Using
each country's weekly number to divide the previous one and getting
the respective ratio for each country in a week. The Table 2 (see
the Tables attached) showed the ratio for the weekly changes in the
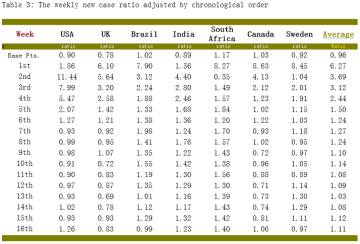
seven countries between the early of March 2020 and July 10, 2020. 3.Selecting
the outbreak starting point that the new cases were reported and
accumulated to be close to 100 (range between 80-110) of the new
case number, as of date of outbreak happened and then making an
adjustment for the starting point for data computation in this
study. The reason for doing so is that the new cases have to be
reported to a significant level as an indication of the outbreak in
the each country and it might happen in different points of timing
(week). According to this starting point, a chronological (weekly)
adjustment was set. For example, the outbreak in USA, from the
reports and records of this study, happened two weeks early than it
happened in India; therefore, the starting point of outbreak for
India would be set as the same as the first week with USA's outbreak
for data comparing purpose. This kind of adjustment was showed in
Table 3 (see the Tables attached), the ratio by chronological order
adjustment for the changes in the seven countries between the early
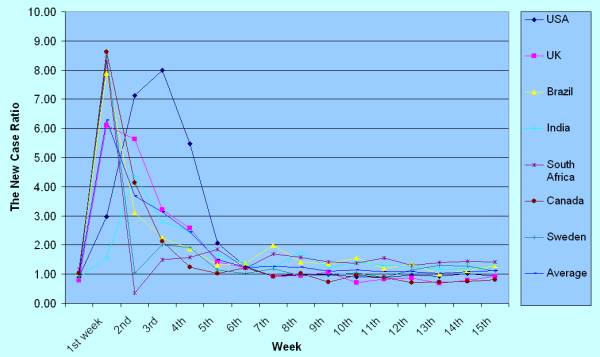
of March 2020 and July 10, 2020. 4.Based
on the adjustment of data in the Table 3, a chart for the weekly new
case ratio in the seven countries is computed for analyzing and
comparing (Chart 1). Finally, a formula or a model used to estimate
the transmissibility of the COVID-19 virus was established (Formula
1) and a respective sensitivity analysis for the formula was
conducted and the results were showed in Table 4. Data: 1.The
numbers of the new cases (data sources) are based on the reports and
records of World Health Organization (WHO) [5]. Those reports
are also available online published by Google News and Wikipedia [6.7].
The numbers of the new cases, daily confirmed and updated, from
United States, Canada, United Kingdom, Sweden, Brazil and India,
between early of March of 2020 and July 10, 2020, were collected for
this study. 2.
The new cases only included people who were tested and confirmed
positive. The number of the new cases recorded by World Health
Organization (WHO) was considered reliable though it may changes due
to not reflecting some cases still being reported. 3.
The population of seven countries are from the data published online
by World Bank, European Union Institutions, Worldometer and
Statistics South Africa [4] Result A
serial set of the ratio for this study was consisted of 16
consecutive weeks as the first week of outbreak for all seven
counties was adjusted to the same point for comparing and analyzing
purpose. The weekly new case ratio and their trends of changes in
seven countries between March 2020 and July of 2020 were showed in
Chart 1. Chart
1: The New Case Ratio for the Seven Countries Between March 2020 and
July 2020.
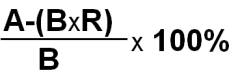
The
ratio as a coefficient to formulate the estimation model, Formula 1,
is described as follows:
where, X:
the extra number estimated in coming interval, a week; C: the case number confirmed in previous
interval, a week; n: the coefficient of the new-case ratio, the
previous interval, a week. For
example, based on the Table 1 and Table 2, the ratio for USA in 7th
week was n=0.93, the number of weekly new case, C=203,054; then, the
number of the weekly new case estimated would be: X=nC=0.93x203,054=201,023.
While the actual the number of weekly new cases was reported in
total of 200,860, the difference was 163, or the difference in
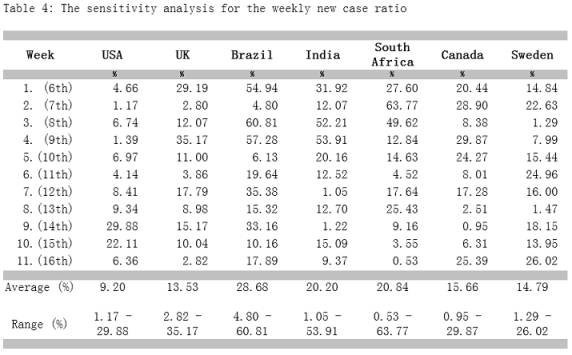
percentage, 1.17%. Sensitivity
Analysis for the Formula: Sensitivity
is generally the ability to appreciate and respond to complex
influences. Assumed that the ratio was available in the 6th
week, and then the ratio could be used for anticipating the number
of new cases in 7th week. By using the number of the weekly new
cases that actually counted in 7th week to check the
number anticipated by the formula model, a sensitivity analysis
could be conducted. The methods for sensitivity analysis was based
on the following calculations:
where, A,
the actual number of the weekly new cases;
B, the number of the weekly new cases before the test;
R, the ratio of the weekly new cases before the test;
(BxR, the new case number estimated by the Formula 1) The
testing numbers for a total of 11 consecutive weeks, starting at 6th
week, were calculated for the each country and the results of the
sensitivity analysis were showed in Table 4 as follows:
Discussion 1.
The result of this study showed that, as the outbreak occurred,
there was always a quite sharp peak of higher increase of the weekly
new cases. It indicated that a rapid growth spread of COVID-19 in
the early stage in a reality, showing the potential and/or natural
value of its Ro. 2.
However, this study, based on a large scale of population, didn’t
find that the number of weekly new cases would keep the same growth
rate as its Ro might be referred in a reality of world, even
considering the value of its Ro 2, as an exponent growth rate, the
number of the weekly new cases would increase at very significant
higher level. 3.
The most interesting finding was the ratio that all seven countries
showed the similar ratio after its outbreak though the absolute
number varied among the countries. As the ratio was generated from
the large scale of population, or an actual indexation from the
reality of the pandemic of COVID-19, it should be reliable and
valuable for estimation its trends of spread. It could be also used
as the index in transmission dynamics, epidemiological surveillance
and evaluation of the prevention measures. 4.
The weekly new case ratio introduced in this study also indicated
the prevalence of COVID-19 might remain a long epidemic period among
the population or could be long-run challenge in public health field
since the ratio would not dramatically drop in seven countries. 5.
The weekly new case ratio intruded in this study was expressed by
the percentage, not the exponent number; therefore, it could
tolerate the range of changes and not bring an exponent power to the
estimation or anticipation in an application of dynamics
transmission of COVID-19. Though the sensitivity analysis for ratio
showed that there were quite range by countries, but the average of
sensitivity still acceptable and its estimation, by the Formula 1,
marched quite well in some countries. The further studies for the
reasons of its sensitivity varied by countries may need. 6.
The factor why the growth ratio not so high after outbreak may be
due to the treatment for the new cases confirmed, as it reduced the
chance for infecting the population; or due to people to adopt other
prevention measures, such as social distancing efforts, washing
hands, and/or other relevant factors. About
author Cheng
Xia has his MD and MPH degree. His primary research interest lies in
epidemiology, health economics and complex disease dynamics inferred
from data science and mathematical modeling. email: xc7788@gmail.com Reference1.Sanche
S, Lin Y, Xu C, Romero-Severson E, Hengartner N, Ke R. High
Contagiousness and Rapid Spread of Severe Acute Respiratory Syndrome
Coronavirus 2. Emerg Infect Dis. 2020;26(7):1470-1477. https://dx.doi.org/10.3201/eid2607.200282 2.Li
Q, Guan X, Wu
P, Wang X, Zhou
L, Tong Y, et
al. Early transmission dynamics in Wuhan, China, of novel
coronavirus-infected pneumonia. N Engl J Med. 2020;382:1199ǔ207. 3.Ying
Liu, Albert A Gayle, Annelies Wilder-Smith, Joacim Rockl. The
reproductive number of COVID-19 is higher compared to SARS
coronavirus. Journal of Travel Medicine, Volume 27, Issue 2, March
2020, taaa021, https://doi.org/10.1093/jtm/taaa021 4.Statistc:
Population Data. http://www.e-df.com/e-datafunction_epi.htm 5.WHO:
Coronavirus Disease (COVID-19) Dashboard. https://covid19.who.int/ 6.Coronavirus
pandemic: daily updated research and data. https://news.google.com/covid19/map?hl=en-CA&mid=%2Fm%2F02jx1&gl=CA&ceid=CA%3Aen 7.
The COVID-19 Pandemic. From Wikipedia, the free encyclopedia.
https://en.wikipedia.org/wiki/COVID-19_pandemic Tables
|
|||||
|
|
|||||